The world’s most watched maritime corridor
What happens when a narrow strip of water carries a fifth of the world’s oil supply?
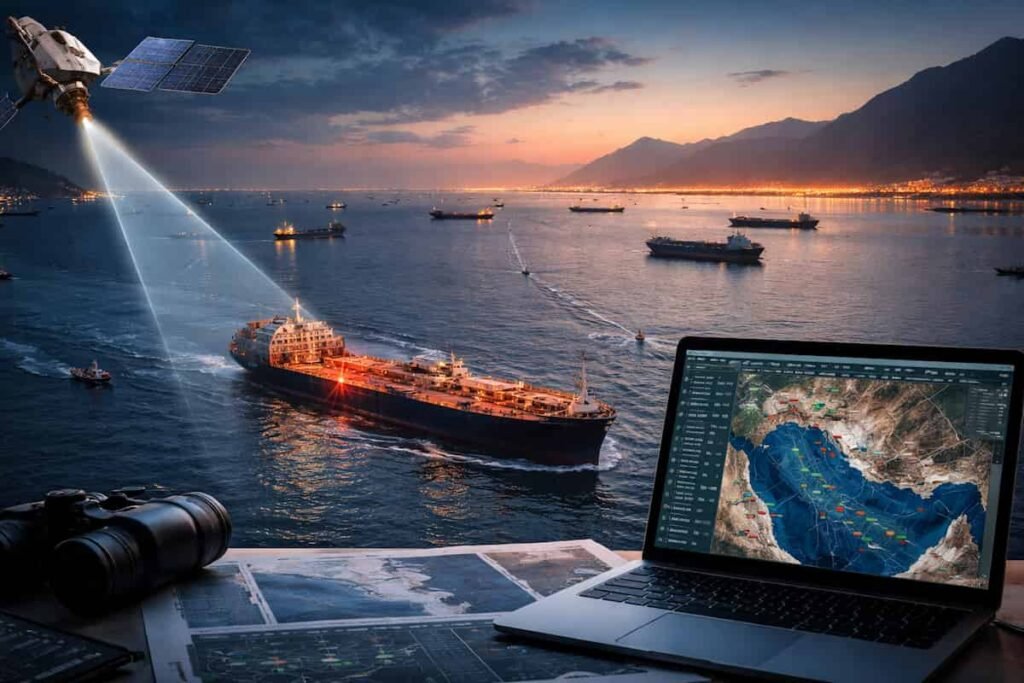
The Strait of Hormuz answers that question every day. Tankers move through a corridor barely fifty kilometers wide, linking the Persian Gulf to the Gulf of Oman and the Arabian Sea. Roughly 21 million barrels of oil per day passed through this route in 2022 — around one fifth of global petroleum liquids consumption.
In moments of geopolitical tension, traffic through Hormuz becomes a strategic indicator. A drop in tanker movements can ripple through energy markets within hours.
For OSINT analysts and investigative journalists, the Strait functions like a live laboratory. Ship tracking signals, radar satellites, and energy databases together reveal patterns that once required classified intelligence.
This guide explains how to monitor the Strait of Hormuz using open-source intelligence, combining maritime tracking, satellite imagery, and energy data.
Why the Strait of Hormuz matters
The world’s main oil chokepoint
The Strait of Hormuz forms the only maritime outlet for oil exports from several major producers:
- Saudi Arabia
- Iraq
- Kuwait
- Qatar
- Iran
- United Arab Emirates
According to the U.S. Energy Information Administration (EIA), average flows reached 21 million barrels per day in 2022.
Few alternatives exist.
Saudi Arabia and the UAE operate pipelines that bypass the strait, but combined capacity reaches around 6.5–7 million barrels per day — far below the volume normally crossing Hormuz.
When disruptions occur, global markets feel it quickly.
Shipping dashboards and maritime analytics platforms sometimes show tanker traffic falling from about 60 vessels per day to near zero during crisis periods. Clusters of ships waiting outside the corridor often reveal bottlenecks or security fears.
For OSINT practitioners, these patterns can be tracked independently.
The OSINT data sources used to track Hormuz
Monitoring maritime chokepoints requires combining several datasets. Each reveals a different piece of the picture.
| Data category | What it reveals | Example sources |
|---|---|---|
| AIS vessel signals | Ship position, speed, identity | MarineTraffic, MyShipTracking |
| Satellite imagery | Physical presence of ships | Sentinel-1, Sentinel-2 |
| Energy databases | Oil flow volumes and infrastructure | EIA, energy research centers |
| Commercial maritime analysis | Cargo movements and shadow fleets | Kpler, TankerTrackers |
Individually, each source carries blind spots. Combined, they create a near-operational view of maritime activity.
AIS tracking: following ships in near real time
What AIS signals show
AIS (Automatic Identification System) transponders broadcast information from vessels:
- position coordinates
- speed
- heading
- vessel identity
- destination port
Coastal receivers and satellites capture these signals and publish them on online maps.
Most large commercial vessels must transmit AIS signals under maritime safety regulations.
That makes AIS one of the most powerful tools in maritime OSINT.
Free AIS platforms useful for Hormuz monitoring
Several public platforms allow analysts to observe traffic around the strait.
| Platform | Access type | Key advantage |
|---|---|---|
| MarineTraffic | Freemium | Vessel filters and basic historical data |
| MyShipTracking | Free | Global real-time vessel map |
| Tradlinx Vessel Tracking | Free with premium options | Search by vessel name, MMSI or IMO |
With these services, analysts can:
- zoom into the Strait of Hormuz
- filter vessels by oil tanker or gas carrier
- observe anchorage clusters near both sides of the strait
- compare snapshots across days or weeks
Some APIs such as VesselFinder or Datalastic export vessel tracks in JSON or CSV format. Analysts can then build their own dashboards.
Reading maritime patterns in the Strait of Hormuz
The traffic separation scheme
Hormuz shipping lanes operate under a Traffic Separation Scheme (TSS).
Two parallel corridors guide vessels:
- inbound tankers entering the Persian Gulf
- outbound tankers heading toward the Arabian Sea
When conditions remain stable, AIS maps show a continuous chain of vessels moving through these lanes.
During crises, patterns change quickly.
Signals that analysts watch closely
Several indicators reveal disruptions.
Vessel counts
Counting tankers crossing the TSS within 24 hours provides a simple baseline.
Changes may indicate:
- military escalation
- shipping insurance restrictions
- temporary port shutdowns
Speed anomalies
Sharp drops in speed often appear when ships approach uncertain waters.
Sudden turns or course reversals may signal perceived threats.
Anchored ship clusters
Large groups of vessels waiting near the entrance of the strait often indicate congestion or security concerns.
AIS heatmaps show these clusters clearly.
AIS blind spots: dark ships and signal manipulation
AIS data alone never tells the full story.
Several techniques complicate maritime tracking.
Dark activity
Ships sometimes switch off their transponders.
This behavior appears frequently in sanctioned oil trades.
Identity spoofing
A vessel may transmit a false identity.
Occasionally the signal belongs to a ship that has already been scrapped.
GNSS interference
Navigation interference in the Persian Gulf has produced distorted positions.
Maps occasionally show impossible clusters of ships sitting on land or in identical coordinates.
Such anomalies require cross-checking with satellite imagery.
Satellite imagery: confirming what AIS cannot show
Satellites reveal the physical presence of vessels regardless of AIS signals.
Two main types of imagery are used.
Optical satellites
Optical sensors capture images similar to aerial photographs.
Common sources include:
- Sentinel-2 (Copernicus program)
- Landsat missions
- commercial satellite imagery
These images reveal:
- tanker shapes
- smoke or fires
- oil spills
- port activity
Clear skies remain necessary.
Radar satellites (SAR)
Synthetic Aperture Radar satellites transmit microwave signals toward the ocean surface.
Ships appear as bright reflections against darker water.
Key advantage: radar works at night and through clouds.
Sentinel-1 radar data plays a major role in maritime OSINT.
Accessing open satellite data
European Copernicus satellites provide free imagery.
Several tools allow analysts to explore these datasets.
| Platform | Type | Use case |
|---|---|---|
| Sentinel Hub EO Browser | Web interface | Quick satellite visualization |
| ESA SNAP software | Desktop processing | Radar ship detection |
| Copernicus Open Access Hub | Data download | Raw imagery access |
These platforms support rapid verification of maritime activity.
Detecting ships with SAR imagery
Radar imagery highlights ships as strong reflectors.
Analysts often follow a simple workflow:
- Download Sentinel-1 radar imagery
- Apply calibration and noise reduction
- Run ship detection algorithms
- Export detected vessels into GIS formats
The result becomes a map of vessel positions independent from AIS.
Comparing SAR detections with AIS tracks exposes dark traffic.
Combining AIS and satellite observations
The strongest maritime OSINT work emerges when datasets converge.
Two common investigative scenarios illustrate this.
AIS signal without satellite confirmation
Possible explanations:
- AIS spoofing
- positioning errors
- outdated ship information
Satellite detections without AIS signals
Likely causes:
- ships operating without transponders
- small vessels not required to broadcast AIS
Commercial analysts studying Iranian oil exports often rely on this combination of data sources.
Energy databases: connecting ships to oil flows
Ship movements alone reveal only part of the story.
To estimate economic impact, analysts connect maritime activity with energy statistics.
Structural energy data
Energy research agencies publish regular reports on global chokepoints.
| Data type | Source | Relevance |
|---|---|---|
| Oil flow volumes | U.S. Energy Information Administration | Global supply context |
| Pipeline capacity | Energy infrastructure studies | Alternative export routes |
| Regional export statistics | Energy research institutes | Market exposure |
Hormuz traffic reflects these structural dynamics.
If tanker counts drop sharply, analysts compare them with pipeline capacity data.
Monitoring sanctioned oil exports
Energy intelligence firms such as:
- Kpler
- TankerTrackers
- Vortexa
track crude oil shipments from sanctioned producers.
Their research highlights techniques used by the so-called shadow fleet:
- ship-to-ship transfers at sea
- prolonged floating storage
- identity changes during voyages
Even without paid subscriptions, many insights appear in public reports and media investigations.
A practical OSINT routine for monitoring Hormuz
Analysts often adopt a structured monitoring workflow.
Step 1 – Daily AIS snapshot
Record tanker counts crossing the TSS at the same time each day.
Basic metrics include:
- number of oil tankers
- number of LNG carriers
- anchored vessels near the strait
Over weeks, this creates a baseline dataset.
Step 2 – Satellite verification
Download Sentinel imagery during notable events.
Radar imagery helps detect ships operating without AIS signals.
Mapping these detections reveals hidden activity.
Step 3 – Energy market context
Compare tanker activity with energy reports and market data.
Indicators worth tracking include:
- Brent oil prices
- shipping insurance premiums
- export statistics from Gulf states
Together these signals reveal whether disruptions remain localized or global.
Step 4 – Event-based investigation
When incidents occur — seizures, attacks, or accidents — analysts build a timeline.
Typical investigation elements include:
- AIS track reconstruction
- satellite confirmation
- official statements and shipping alerts
The 2019 seizure of the Stena Impero tanker illustrated this approach.
AIS data revealed the vessel’s deviation from shipping lanes, while satellite imagery confirmed its presence near Bandar Abbas.
Key OSINT tools for monitoring Hormuz
| Category | Tools | Strength | Limitation |
|---|---|---|---|
| AIS maps | MarineTraffic, MyShipTracking | Real-time vessel overview | Limited historical depth |
| AIS APIs | VesselFinder, Datalastic | Structured tracking data | Premium access required |
| Optical satellites | Sentinel-2 | Visual confirmation | Weather dependent |
| Radar satellites | Sentinel-1 | Works at night and through clouds | Requires processing skills |
| Energy databases | EIA reports | Reliable macro data | Low temporal resolution |
| Commercial intelligence | Kpler, TankerTrackers | Detailed cargo analysis | Mostly subscription based |
No single dataset tells the entire story. Cross-checking remains essential.
Risks, biases and ethical considerations
Maritime OSINT carries several challenges.
Data reliability
AIS spoofing and GNSS interference occasionally distort vessel positions.
Selection bias
Focusing only on supertankers may hide changes in smaller cargo flows.
Narrative amplification
Maps showing dense ship clusters often circulate widely online.
Without context, these visuals can trigger misleading conclusions.
Responsible analysis requires transparency about data limits.
Most AIS and satellite imagery platforms allow legitimate research usage when analysts follow their licensing terms.
Publishing sensitive operational details that could endanger crews or interfere with rescue operations should always be avoided.
Why Hormuz remains a perfect OSINT training ground
Few places illustrate the power of open-source intelligence better than the Strait of Hormuz.
A single maritime corridor connects:
- global energy markets
- military tensions
- commercial shipping networks
Open datasets now allow independent analysts to track these dynamics almost in real time.
AIS feeds reveal vessel movements. Radar satellites confirm what signals hide. Energy databases translate ship counts into global market consequences.
For journalists, researchers, and OSINT investigators, Hormuz provides a reusable blueprint.
The same workflow works for other chokepoints:
- Suez Canal
- Bab el-Mandeb
- Strait of Malacca
Each corridor tells a story about trade, risk, and geopolitics.
Want to explore maritime OSINT yourself?
Start simple.
Open an AIS map. Zoom into the Strait of Hormuz. Count the tankers crossing the shipping lanes today.
Then pull a Sentinel radar image from Copernicus.
You may discover that the world’s most strategic oil corridor is visible — almost in real time — through nothing more than open data and patience.
Join the OSINT & AI community
Newsletter: https://projectosint.substack.com/
Telegram: https://t.me/osintaipertutti
Telegram: https://t.me/osintprojectgroup